
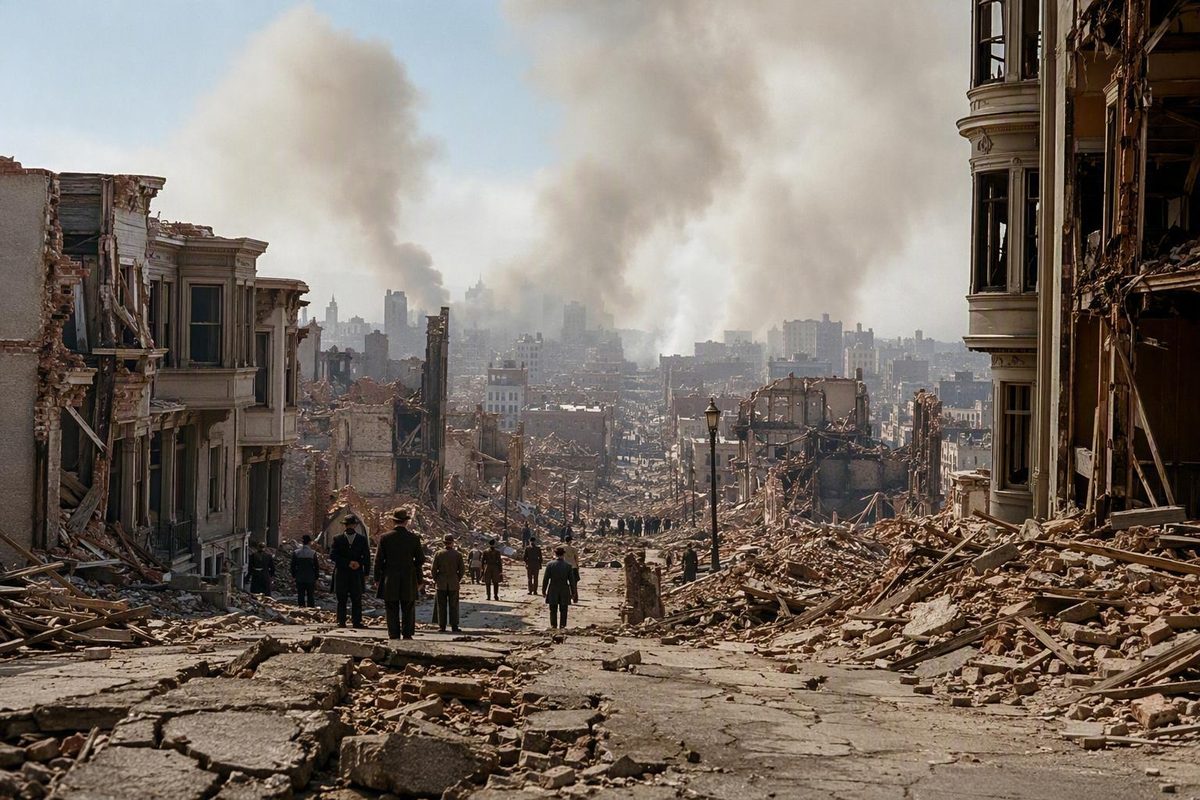
The San Francisco, California, earthquake of 1906 is often reduced to a few familiar images: fractured streets, leaning buildings and refugees watching smoke rise over the city. Yet magnitude alone does not explain the catastrophe. A long rupture of the San Andreas Fault struck a region with vulnerable buildings and sharply varying ground conditions. Shaking then damaged gas, electrical and water systems, allowing numerous fires to spread while firefighters had little reliable water.
The result was not one disaster but a chain of connected failures. Tens of seconds of violent motion became three days of fire, mass displacement, regional damage and a turning point in earthquake science.
The 1906 earthquake at a glance
Essential facts—all historical figures are estimates
- Date and time: About 5:12 a.m. local time on Wednesday, April 18, 1906
- Estimated magnitude: About 7.9
- Probable initiation area: Beneath the ocean just west of San Francisco
- Fault: Northern San Andreas Fault
- Rupture length: Roughly 270 to 296 miles in authoritative summaries, although some reconstructions extend it farther
- Strong shaking: Approximately 45 to 60 seconds
These geological and timing estimates are summarized by the U.S. Geological Survey’s account of the rupture.
- Foreshock: A widely felt foreshock preceded the main rupture by about 20 to 25 seconds; residents received no practical warning
The foreshock interval and strong-shaking duration come from the USGS historical overview.
- Fire: Several fires burned for about three days
- Deaths: Modern estimates commonly place the toll near or above 3,000
- Homelessness: Approximately 200,000 people, or about half the city’s population
- Urban destruction: Nearly 500 city blocks
These human and urban-loss estimates are documented by the National Archives.
- Other destruction measures: About 28,000 buildings, 4.11 square miles or more than 80% of San Francisco
These figures use different units and should not be treated as interchangeable totals; the building and area estimates are reported by the Gilder Lehrman Institute of American History.
The short interval between the foreshock and the main rupture did not amount to a warning in any useful sense.
This was also a Northern California earthquake, not merely a downtown San Francisco disaster. Shaking was reported from southern Oregon to the Los Angeles region and east into central Nevada. Severe effects occurred along a fault rupture hundreds of miles long, even though San Francisco’s fires came to dominate photographs, news accounts and public memory.
Destruction totals require careful interpretation. A count of buildings measures structures; a block count measures urban units; a percentage describes a share of the city; and square mileage describes physical area. The estimates may also include different combinations of shaking damage, fire loss and deliberate demolition. Their differences do not automatically indicate a contradiction.
Nearly every familiar number attached to 1906 is a reconstruction. The earthquake occurred before a nearby modern instrumental network existed. Records were incomplete, and the destruction of homes, public buildings and documents complicated casualty and property accounting. Magnitude, initiation point, rupture length, shaking duration, deaths, homelessness and physical losses therefore belong in ranges or with qualifying words such as “about,” “approximately” and “estimated.”
That uncertainty does not obscure the larger sequence. A very large regional earthquake was followed by an urban fire disaster made far worse by damaged infrastructure.
From foreshock to fire: a timeline of the disaster
About 5:12 a.m., April 18: A foreshock was felt across much of the San Francisco Bay Area. The main rupture began approximately 20 to 25 seconds later. The interval was too short and ambiguous to provide residents with a functional warning.
The next minute: Strong shaking continued for an estimated 45 to 60 seconds. Buildings lurched, masonry walls and brick chimneys fell, and residents were thrown from sleep into darkness and confusion. Streets and streetcar tracks were damaged. Beneath them, water and gas pipes broke; electrical lines and equipment were also damaged.
These failures occurred together but produced different forms of loss. Collapsing masonry could kill or injure immediately. Ground failure could deform streets and foundations. Broken utilities created hazards that continued after the shaking ended.
The first minutes afterward: Fires began in several parts of the city. It is misleading to assign every outbreak to one cause. Separate fires could have had different origins.
The condition of the water system turned those ignitions into a much larger emergency. Firefighters normally relied on hydrants supplied by pressurized municipal mains. Once mains ruptured and pressure fell, crews could reach a fire but still lack the water needed to contain it. Numerous outbreaks were spreading just as the city’s principal suppression system was failing.
During April 18: Firefighters, soldiers, officials and residents improvised. Crews attempted to pump water from San Francisco Bay where equipment and access allowed it. Firefighters and troops also demolished or blasted buildings in attempts to create firebreaks.
The purpose of demolition was straightforward: remove combustible material in front of an advancing fire. Its overall effect is much harder to determine. Individual operations may have had different outcomes, and the available evidence does not justify a citywide verdict that dynamiting either saved San Francisco or caused most of the destruction.
April 18 through about April 21: Separate fires merged, changed direction and moved across large sections of the city. The California Geological Survey describes the fire as lasting three days and destroying thousands of buildings, while its historical material also records evacuation, aftershocks and firefighting without dependable water.
As the fire advanced: Residents carried what they could and abandoned threatened areas. Some moved more than once as fire lines shifted. Parks, open spaces and the Presidio became places of refuge.
In the following days and weeks: Emergency camps took shape. Survivors waited for food, water and other supplies, and many cooked in streets to reduce the danger of additional building fires. Army personnel, firefighters and city officials participated in suppression, security, relief and logistics. Aid arrived from elsewhere in the United States and from other countries.
The timeline is therefore not simply “earthquake, then recovery.” It is foreshock, main rupture, structural and utility failure, multiple ignitions, constrained suppression, expanding fire, evacuation, mass shelter and outside relief. Each stage changed what could happen in the next.
What caused the earthquake—and how its size was reconstructed
The earthquake occurred on the San Andreas Fault, a major boundary accommodating relative movement between the Pacific Plate and the North American Plate. In the Bay Area, its motion is predominantly right-lateral strike-slip: viewed from either side of the fault, the land across it moves horizontally to the right.
The plates do not slide smoothly past one another everywhere and at all times. Parts of a fault can remain locked while continuing plate motion deforms the surrounding crust. In 1906, accumulated strain was released when a long section of the northern San Andreas Fault slipped.
USGS reconstructions favor an initiation point beneath the ocean just west of San Francisco, followed by rupture both northwest toward Cape Mendocino and southeast toward the San Juan Bautista area. The exact initiation point remains uncertain, and it must be distinguished from the much larger fault segment that subsequently broke.
Calling the earthquake “magnitude 7.9” is useful, but it can create a false impression of instrumental precision. No nearby network of modern earthquake-measuring instruments recorded the event. Scientists instead reconstructed its size from evidence that survived the disaster.
That evidence includes building damage, reports of where people felt shaking, changes in soil and ground conditions, mapped surface offsets, displaced fences and roads, historical photographs, liquefaction observations and geodetic measurements showing how surveyed positions changed. The California Academy of Sciences explains why 7.9 is the usual estimate while acknowledging that higher values have been proposed in the historical reconstruction of the earthquake’s magnitude.
No single damaged building, photograph or eyewitness report determines magnitude. Researchers compare many incomplete observations with physical models of fault slip and seismic-wave behavior. Different studies may select different evidence, model the fault differently or use analytical methods developed long after 1906.
That is why estimates extend roughly from 7.7 to above 8.0. Reported rupture lengths also vary because researchers may disagree about where continuous rupture ended, which subsidiary breaks to include and how incomplete field observations should be interpreted.
Magnitude must also be distinguished from Modified Mercalli intensity:
- Magnitude characterizes the earthquake’s overall size.
- Intensity describes the strength and observed effects of shaking at a particular location.
One earthquake has an overall magnitude estimate but produces many local intensities. A district on soft sediment may experience more damaging motion than a bedrock site at a similar distance from the fault. Vulnerable masonry and a better-connected frame building on the same street may also respond differently.
Published maximum-intensity results for 1906 are not entirely uniform. Intensity maps depend on which observations survive, their geographic coverage and the method used to translate descriptions into intensity levels. Modified Mercalli values are usually written as Roman numerals to distinguish them from magnitude, as the USGS comparison of Bay Area shaking intensity explains.
The distinction resolves an apparent puzzle. One large earthquake can produce sharply different outcomes across the affected region. Rupture size matters, but so do rupture direction, seismic waves, local ground conditions and the buildings standing at each location.
Why destruction varied from one place to another
Equal distance from an initiation point does not mean equal damage. Outcomes in 1906 reflected at least five analytically distinct processes:
- shaking of buildings and contents;
- amplification of motion by local geology;
- liquefaction and other ground failure;
- utility damage and subsequent fire;
- deliberate demolition intended to slow the fire.
These processes interacted, but separating them first helps explain why adjacent or similarly distant places could look very different afterward.
Soft sediment and site amplification
Seismic waves can behave differently as they pass from firm rock into softer sediment. Sediment-filled valleys and basins may amplify certain motions or prolong shaking compared with nearby bedrock sites.
A bowl of gelatin offers a rough analogy: disturbing the container can make the softer contents move more visibly than the rigid bowl. Actual seismic behavior is considerably more complex, but the comparison illustrates why the material beneath a site matters.
Lawson’s historical investigation, as summarized by USGS, found a clear relationship between observed shaking intensity and underlying geology. Sediment-filled valleys generally experienced stronger shaking than nearby bedrock locations, and some of the strongest effects occurred where reclaimed land around San Francisco Bay failed.
Filled ground, liquefaction and ground failure
Parts of the developed bay margin had been created over former marshes, creeks, coves or shallow water using artificial fill. Where loose, water-saturated material was shaken intensely, it could lose strength, settle, deform or spread laterally. This behavior is commonly associated with liquefaction, although historical ground failures may involve several related processes.
Liquefaction does not mean that every parcel of filled land behaved identically or became an open pool of liquid. Performance depended on the fill’s composition, compaction and saturation, as well as the strength and duration of shaking.
Former bay margins were nevertheless particularly susceptible. Foundations shifted, pavements distorted and buried utility lines could be pulled apart.
Construction type
Unreinforced masonry was especially vulnerable to strong lateral motion. Brick walls and chimneys could carry heavy vertical loads under ordinary conditions but lacked the reinforcement and connections needed to resist violent side-to-side movement. Walls separated, parapets fell and chimneys crashed through roofs or into rooms.
Many wood-frame buildings flexed more successfully during the shaking, while steel-frame structures often resisted collapse better than brittle masonry. That relative performance should not be mistaken for immunity. A wood building that remained standing could burn once fire reached it. A steel frame might survive structurally while floors, partitions, roofs and contents were consumed. Contemporary historical analysis distinguishes these construction outcomes in its discussion of building performance and filled ground.
“Survived the earthquake” and “survived the disaster” are therefore different judgments. Initial performance depended heavily on structural design and ground conditions. Survival over the following days also depended on proximity to the fires, nearby fuel, available water and suppression efforts.
A personal view from Pacific Heights
In an eyewitness account preserved by the California Geological Survey, Eleanor Watkins observed that Pacific Heights appeared to have suffered comparatively limited damage apart from fallen chimneys. Her statement is valuable as an individual impression, not as a comprehensive engineering survey. She could describe what she saw along her route, but not every building, street or hidden form of damage across the neighborhood. Her testimony appears within the survey’s historical account of the earthquake and fire.
That limitation applies broadly to survivor testimony. A person near a collapsed building, deformed street or advancing fire could reasonably perceive devastation as universal. Someone on firmer ground in a district spared by fire could see a much less damaged city. Both accounts might be sincere while remaining geographically incomplete.
A later technical reconstruction placed the strongest modeled ground motions north of San Francisco and in areas south of the city rather than necessarily within downtown itself. That finding reinforces the importance of the long rupture and regional geology, although it remains a reconstruction rather than a direct instrumental record of the 1906 ground-motion pattern.
The final pattern was a composite. Geology influenced shaking and ground failure. Construction affected whether buildings stood. Ground movement damaged utilities. Fire then crossed distinctions that had mattered during the earthquake itself, destroying some structures that had performed relatively well during the initial motion.
Why fire destroyed more of San Francisco than shaking alone
The central causal chain can be stated plainly:
Violent shaking damaged buildings and utilities. Multiple fires ignited. Broken water mains deprived firefighters of normal hydrant supplies. Wind, combustible structures and simultaneous outbreaks strained available crews. The fires continued for about three days.
The earthquake and fire were connected but distinct phases. Ground motion initiated the emergency and created the conditions for fire, but it did not directly account for every building lost. Some structures collapsed during shaking; some were damaged and later burned; some survived the motion but were consumed by fire; and others were demolished in attempts to stop the flames.
Possible ignition routes included broken gas pipes, damaged electrical systems, stoves and fallen chimneys disturbing fires or hot material. Assigning one universal cause would erase the fact that several fires began in different parts of the city under different circumstances.
The city did not simply need more firefighters. It needed a functioning way to deliver water. Damaged streets and multiple fire fronts impeded movement, but even crews that reached a hydrant could find inadequate pressure or no supply.
Firefighters attempted to overcome that failure by pumping water from the bay where possible. Firefighters and troops also blasted buildings to establish firebreaks. In principle, a sufficiently wide gap could deprive an approaching fire of fuel. In practice, success depended on timing, placement, available expertise and whether flames or embers could cross the gap.
Demolition remains one of the most disputed parts of the response. It was intended to stop the conflagration, not to cause indiscriminate destruction. Individual operations may have produced different results.
The scale of loss can be expressed as approximately 4.11 square miles, 28,188 buildings, nearly 500 blocks or more than 80% of the city. These are different measures, drawn from historical reconstructions with different definitions. They do not mean that every listed building burned or that every loss resulted directly from ground motion.
This is why “the 1906 earthquake and fire” is the more accurate name. The fault rupture explains the initial violence and regional reach. The conflagration explains much of San Francisco’s urban devastation. Infrastructure failure connects the two.
Deaths, displacement, and life after the fires
For decades, accounts often repeated an official death count of roughly 500 to 700. Authoritative modern summaries regard that figure as a major underestimate. USGS, for example, describes the frequently quoted total of 700 as too low by a factor of three or four.
Approximately 3,000 deaths, and possibly more, is now the commonly cited estimate for San Francisco and nearby areas. It is not a final list of every victim. The evidence supports the conclusion that the older official count was far too low, but it does not establish that civic leaders deliberately concealed the toll.
Displacement can be stated with somewhat more confidence, though still not exactly. About 200,000 people—and perhaps more—lost their homes. That was approximately half the population of a city of about 400,000 residents.
Homelessness was not a single experience. Some survivors stayed with relatives or friends. Others slept outdoors, moved into emergency camps or left the city. Tents appeared in parks and at the Presidio. People waited in food lines and cooked in streets to reduce the danger of starting additional fires.
Relief required coordination among firefighters, Army personnel, city officials, charitable groups and governments outside San Francisco. Aid arrived from across the United States and abroad. Congress funded food, water, tents, blankets and medical supplies, as well as work on damaged or destroyed public buildings. Congressional committees also handled property claims and requested official reports on the earthquake, fire and relief response. These measures and the conditions in survivor camps are documented in the National Archives’ exhibit on federal relief.
Army reports and captioned photographs now provide an important institutional record, although official documentation should be read alongside civilian testimony rather than treated as a replacement for it.
Eleanor Watkins’s account offers one such civilian perspective. She described damaged buildings, evacuation, aftershocks, fire fronts and property loss. Her narrative conveys the confusion of a city in which reliable information was scarce and rumors circulated quickly.
That immediacy is both its strength and its limitation. Watkins sometimes distinguished what she had seen from what she had heard, but her account still contains hearsay and incomplete information. The source preserving her testimony gives conflicting casualty figures for the Valencia Street Hotel. The responsible conclusion is therefore that the building collapsed with fatal consequences, not that one precise death total has been verified.
Personal testimony is most useful at its proper scale. It can show what evacuation felt like, what survivors carried, how people interpreted aftershocks and how shifting fire lines forced repeated movement. It cannot independently settle a citywide death count or establish the performance of an entire neighborhood.
After the flames subsided, survivors still had to find shelter, food, water, medical care and information about missing people. The human duration of the disaster was therefore far longer than either the shaking or the fire. For hundreds of thousands of people, April 18 marked the beginning of displacement rather than the end of the emergency.
Rebuilding San Francisco—and the limits of a simple resilience story
Reconstruction began quickly. Streets were cleared, transportation restored, temporary structures erected, and homes and workplaces replaced. Speed mattered because residents needed shelter and businesses needed to function.
A commemorative account reports that more than 20,000 buildings had been constructed by 1909. It also describes the restoration of public transit, a transition toward electric streetcars, and Julia Morgan’s work on rebuilding projects that included the Merchants’ Exchange and the Fairmont Hotel. The figure should be read as an attributed report rather than an uncontested final count. (Downtown San Francisco reconstruction account)
Transit restoration was more than symbolic. Reconnecting residential areas with downtown helped workers reach jobs and supported renewed commercial activity. Reopened routes also made a fractured city more navigable while entire districts were under reconstruction.
Fast rebuilding did not automatically mean safer rebuilding. The same commemorative account reports that some standards were temporarily relaxed during the rush to construct new buildings. That complicates the familiar claim that San Francisco immediately absorbed every safety lesson and rebuilt according to uniformly improved principles.
Many California municipalities had building codes in 1906, but those codes generally did not account for seismic forces. Earthquake-related requirements developed after the disaster, while stronger and more uniform statewide standards emerged incrementally over subsequent decades rather than through one immediate reform. (Utah earthquake program overview)
Safety also depends on more than the existence of a code. Engineering knowledge, enforcement, materials, structural alterations, soil conditions, and fire protection all affect performance. Rapid construction can reproduce old vulnerabilities if speed, cost, or inadequate standards govern the work.
“Resilience” is therefore a valid but incomplete lens. San Francisco restored transportation, replaced buildings, reopened businesses, and re-established civic functions. Those accomplishments required extensive labor and organization.
But visible reconstruction followed more than 3,000 estimated direct and indirect deaths, mass homelessness, coercive emergency measures, and the destruction of livelihoods as well as buildings. Rapid construction does not by itself show how quickly individual households recovered or who gained access to housing, money, employment, and political influence. (USGS casualty and damage summary)
The supplied evidence does not support a detailed account of reconstruction finance, renters’ experiences, Chinatown, immigrant communities, long-term camp life, or residents who left permanently. Those subjects require additional archival research and should not be filled in through assumption.
A balanced interpretation recognizes two realities at once: San Francisco rebuilt with remarkable speed, but the surviving evidence here does not demonstrate that recovery was uniform. Resilience describes what the city accomplished. It should not erase what individuals lost or imply that rebuilding canceled the catastrophe.
A Northern California disaster, not only a San Francisco story
The familiar name “San Francisco earthquake” is convenient but geographically misleading. The event involved a rupture spanning hundreds of miles of the northern San Andreas Fault. San Francisco suffered the most famous urban catastrophe, but the city occupied only one part of a much larger seismic landscape.
The rupture extended broadly from the San Juan Bautista area northwest toward Cape Mendocino. USGS gives a length of approximately 296 miles, while the California Geological Survey summarizes it as nearly 270 miles. Other reconstructions extend the rupture farther. These differences depend on how researchers define and map its endpoints.
The felt area was larger still. Shaking was reported from southern Oregon to south of Los Angeles and east into central Nevada. Feeling an earthquake does not mean that every place within that area was badly damaged, but the geographic extent demonstrates that this was a major regional event.
Severe shaking and structural damage occurred outside San Francisco, particularly along the wider fault corridor. Later research discusses 1906 damage from Mendocino County in the north to Monterey County in the south. The same technical work cautions that reconstructed ground-motion patterns are estimates and that a future earthquake would not necessarily reproduce them exactly; its historical discussion nevertheless documents the broad Northern California damage corridor.
San Francisco’s fires attracted attention because they devastated a major city and produced extraordinary photographs. They should not be used as the sole measure of the earthquake’s reach.
Three geographic concepts must remain separate:
- The probable initiation area was a relatively small offshore zone near San Francisco.
- The rupture was a long section of the San Andreas Fault extending northwest and southeast.
- The felt area covered a much larger portion of the western United States.
Treating these as one shaded region would create confusion. An initiation point is not the same thing as the full rupture, and neither is equivalent to the territory in which people noticed shaking.
The regional perspective also explains why the strongest reconstructed motions need not have been centered in downtown San Francisco. A long rupture releases energy along an extended fault, while local rock and sediment modify the waves reaching each location. Proximity to the city that gave the earthquake its popular name was not the only controlling variable.
Calling it the San Francisco earthquake remains understandable: the city was the best-known center of destruction and displacement. Calling it only a San Francisco story, however, obscures the geology. It was a Northern California fault rupture whose most memorable urban consequences occurred in San Francisco.
1906 versus Loma Prieta—and where the history remains visible
For many people alive today, the 1989 Loma Prieta earthquake is the Bay Area’s defining seismic memory. It was a destructive magnitude 6.9 earthquake, but it was substantially smaller than the reconstructed 1906 event.
| Comparison | 1906 earthquake | 1989 Loma Prieta earthquake |
|---|---|---|
| Magnitude | Estimated Mw 7.9 | Mw 6.9 |
| Relative energy | Approximately 16 times Loma Prieta | Baseline for comparison |
| Strong shaking | Historical estimates of roughly 42–60 seconds | About 15 seconds |
| Rupture pattern | Long section of the northern San Andreas Fault | Shorter rupture in the Santa Cruz Mountains region |
| Geographic reach of intense shaking | Broad, extending along a long rupture | More geographically limited |
| Main historical image | Earthquake followed by three days of urban fire | Structural and infrastructure failures during a shorter event |
The same seismograph in Göttingen, Germany, recorded both earthquakes. USGS analysis estimates that the 1906 magnitude 7.9 event released approximately 16 times as much energy as magnitude 6.9 Loma Prieta. The agency also uses 45–60 seconds or more as scenario language for the possible duration of strong shaking in a future 1906-type rupture, compared with about 15 seconds in 1989. That prospective scenario should not be confused with an exact historical measurement of the 1906 duration. The distinction appears in the USGS seismogram comparison.
The comparison does not mean every location shook for precisely four times as long in 1906 or that damage increases in direct proportion to magnitude. Local intensity still depends on distance, soil, construction and the character of the seismic waves.
Likewise, USGS discussion of a future “1906-type” event is an expectation used in hazard analysis, not a prediction. It does not specify when such an earthquake will occur, which sections will rupture or how every modern building and utility network will perform.
Places that connect the modern city to 1906
Much of the visible city was rebuilt, but several places can help visitors understand the disaster in physical terms.
Lotta’s Fountain, at Market, Geary and Kearny streets, became a gathering point where survivors searched for missing people and left messages. Its importance lies less in damage to the monument than in the need for a recognizable meeting place after communications and familiar addresses had broken down.
Golden Gate Park and the Presidio connect the modern landscape to the refugee experience. Their open spaces accommodated tents and emergency life after dense residential districts became unsafe or burned. Today’s landscape does not reproduce the camps exactly, but it helps convey the amount of open ground required to shelter a displaced population.
Jackson Square is reported to have remained largely intact compared with surrounding burned districts. That statement comes from a local commemorative account rather than a complete building-by-building survey, so it should be treated as a district-level observation, not proof that every structure survived. Lotta’s Fountain and Jackson Square are discussed in Downtown San Francisco’s commemorative history.
Point Reyes offers a different connection. It moves attention away from the urban ruins and toward the fault itself. The landscape around the San Andreas trace helps explain horizontal strike-slip movement and the regional scale of the rupture. Visitors should verify current access conditions rather than assume that every historical feature or trail is always available.
Considered together, these places represent different links in the disaster chain. Lotta’s Fountain represents disrupted communication. Parks and the Presidio represent mass shelter. The burned district represents infrastructure failure and fire. Point Reyes represents the tectonic process that started the catastrophe.
Fact versus myth
Fact: The 1906 earthquake was substantially larger than Loma Prieta in magnitude, energy release, rupture extent and duration of strong shaking.
Myth: Magnitude alone predicts damage at every location. Ground conditions, construction, fire and utility failures can produce sharply different outcomes.
Fact: Fire destroyed much of San Francisco after the earthquake.
Myth: Surviving records prove that fire caused most of the deaths. They do not provide a reliable cause-by-cause fatality count.
Fact: The event was historically exceptional and devastating.
Myth: It was the strongest or deadliest earthquake in world history. Stronger and far deadlier earthquakes have occurred elsewhere, as summarized by the Earthquake Country Alliance’s review of earthquake myths.
How the earthquake changed science—and how to explore the evidence
In 1906, the San Andreas Fault was not understood as it is today. The earthquake exposed striking horizontal displacement over an extraordinary distance. Fences, roads and other features had shifted sideways across the fault. Contemporary geologists had to explain not merely why the ground shook, but how such a long section of crust had moved.
Analysis of displacement and deformation led geophysicist Harry Fielding Reid in 1910 to formulate elastic-rebound theory. In plain language, the theory proposes that strain builds in the crust while a fault is locked. When accumulated stress overcomes resistance, the fault slips and the deformed crust rebounds toward a less strained condition. USGS describes Reid’s model as foundational to understanding the earthquake cycle in its scientific overview of the 1906 event.
Elastic rebound does not predict the exact date of the next earthquake. It describes a physical process by which strain can accumulate and then be released. The timing and location of a future rupture depend on conditions that cannot be observed or modeled with perfect completeness.
The disaster also demonstrated the importance of local ground conditions. Mapping where shaking was strongest showed that geology mattered: soft sediments and reclaimed margins could experience more severe effects than nearby bedrock. That principle became important to seismic zoning, engineering and hazard analysis.
Historical evidence remains central because no nearby modern instrumental network captured the earthquake. Researchers draw on:
- photographs of fault offsets and damaged structures;
- surveys made before and after the event;
- descriptions of shaking and ground failure;
- maps of fire progression and urban destruction;
- building-performance records;
- military, municipal and congressional documents;
- letters, diaries, newspapers and eyewitness accounts.
Each source type answers different questions. A photograph may show a displaced fence but not establish the timing of every movement. A diary may preserve fear and confusion while misstating an event across town. A military report may document supplies while overlooking experiences beyond its administrative scope. Reconstruction becomes stronger when evidence is compared rather than treated as self-sufficient.
A brief comparison with the 1989 Loma Prieta earthquake helps put 1906 in perspective. Loma Prieta was nevertheless locally destructive. The comparison shows why magnitude and location-specific intensity cannot be substituted for one another: a smaller earthquake can cause severe damage in particular places, while a larger event produces a wider and more complex pattern of effects. USGS presents the contrast through statewide maps, intensity maps and earthquake records in its 1906–1989 comparison.
Readers interested in the geology can explore the USGS materials on plate motion, fault rupture, historical damage, liquefaction and engineering consequences. These resources distinguish the probable initiation area from the rupture’s propagation and place San Francisco within the broader regional event.
For government records, the National Archives holds Army reports and photographs, congressional relief records, property-claim material and documentation of damage to public buildings. These records are particularly useful for studying how federal institutions responded and what supplies, funds and reports they generated.
The Online Archive of California brings together selected holdings from the Bancroft Library, California Historical Society, California State Library, Stanford University, Huntington Library and Society of California Pioneers. Its 8,920 digital objects are described as approximately 14,000 images and 7,000 pages of text. The collection is selective rather than comprehensive, and access or reproduction may be limited by copyright, privacy, publicity rights or individual repository rules, as explained in the collection finding aid.
Historical lessons must also be separated from current safety advice. The 1906 record explains how ground conditions, construction, utilities and firefighting capacity interacted. It does not by itself supply a current preparedness plan or a reliable probability for a future event. Present-day safety recommendations, building guidance and earthquake forecasts should be checked against current USGS and local emergency-management information.
Frequently asked questions
What time did the 1906 San Francisco earthquake happen?
The earthquake struck at about 5:12 a.m. local time on Wednesday, April 18, 1906. A broadly felt foreshock preceded the main rupture by approximately 20 to 25 seconds, but the interval was too short and uncertain to provide residents with a practical warning. The timing and foreshock sequence are summarized in the historical record of the 1906 earthquake.
Was the 1906 earthquake magnitude 7.9, and why is that number an estimate?
About magnitude 7.9 is the most commonly used modern estimate, but it was not a direct reading from a nearby modern instrument. Scientists reconstructed the earthquake’s size from building damage, felt reports, soil changes, surface offsets, photographs and geodetic measurements.
Different selections of evidence and different analytical methods have produced estimates ranging roughly from 7.7 to above 8.0. It is therefore accurate to call the earthquake an estimated magnitude 7.9, not an event measured exactly at 7.9 in 1906.
How long did the earthquake last, and how long did the fires burn?
Strong shaking lasted approximately 45 to 60 seconds, although duration estimates vary by reconstruction. The fires burned for about three days, according to the California Geological Survey’s account.
Those durations describe separate phases. Shaking damaged buildings, streets and utilities in less than a minute. Multiple fires then spread through a city with broken water mains and limited suppression capacity.
How many people died or were left homeless in the 1906 disaster?
Modern estimates commonly place the death toll at approximately 3,000 or more. The older official count of roughly 500 to 700 is widely regarded as a serious underestimate, but the exact revised total remains unresolved.
Approximately 200,000 people or more were left homeless—about half of San Francisco’s population at the time. Many displaced residents sheltered in tents in parks or at the Presidio and depended on distributed food, water, blankets and medical supplies.
Why was damage worse on filled ground than on bedrock?
Loose, water-saturated fill can lose strength during strong shaking. The resulting settlement, lateral movement, liquefaction and deformation can damage foundations, streets and buried pipes. Soft sediment can also amplify or prolong some seismic motions compared with nearby bedrock.
Not all filled ground failed uniformly; outcomes depended on material, compaction, water conditions and shaking intensity. Nevertheless, reclaimed former bay margins experienced some of the strongest documented ground failures in 1906, as shown in the USGS virtual tour’s historical photographs and liquefaction material.
The enduring lesson is causal rather than merely numerical. The catastrophe was not simply the product of a large magnitude. A regional fault rupture encountered vulnerable ground and buildings; broken utilities turned structural damage into a fire emergency; and limited water combined with simultaneous outbreaks to produce a citywide conflagration.
Uncertainty around individual figures does not weaken that account. Tens of seconds of shaking led to three days of fire, mass displacement, regional damage and scientific findings that still shape how earthquakes are understood. Readers who want to examine the surviving record can continue with USGS materials, National Archives documents and the multi-institution Online Archive of California collection.