
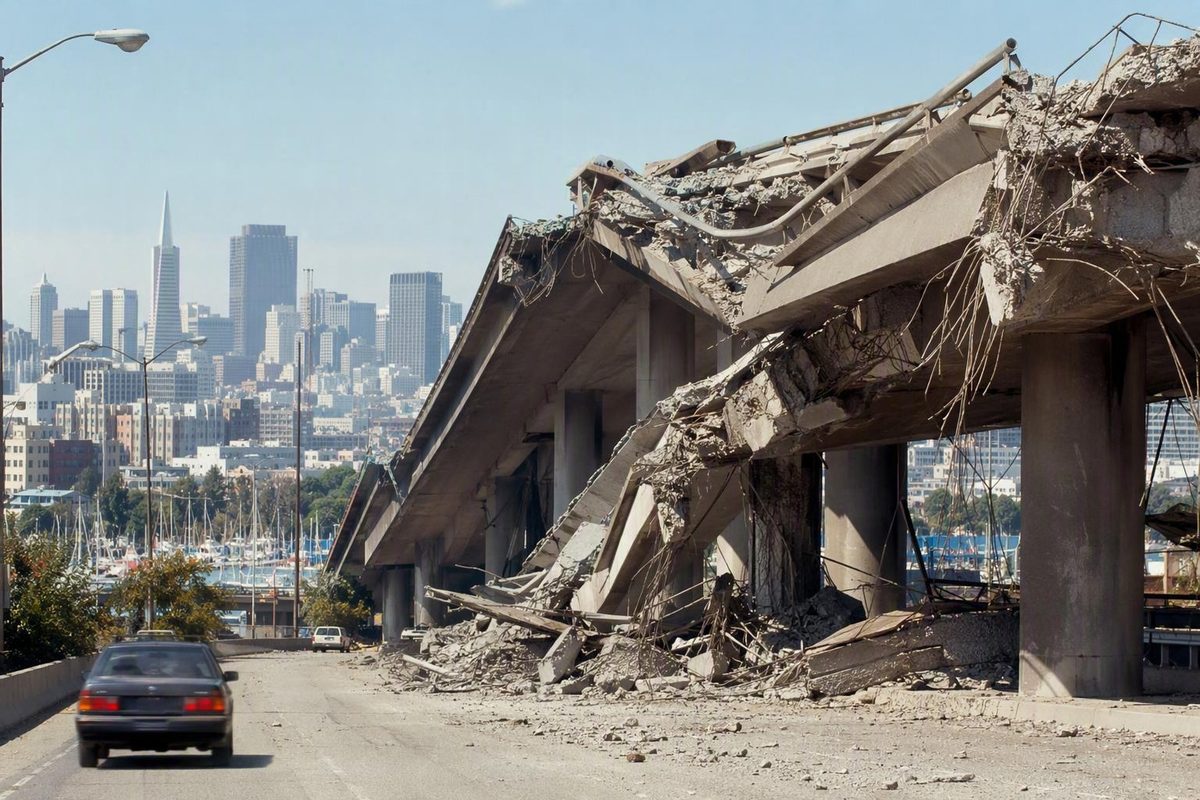
The disaster often remembered as the San Francisco California earthquake of 1989 did not begin in San Francisco. Its rupture started beneath the Santa Cruz Mountains near Loma Prieta, close to Santa Cruz and roughly 56–60 miles south of San Francisco.
Yet distance alone did not determine the outcome. Older masonry buildings failed in Santa Cruz, a double-deck freeway collapsed in Oakland, and loose artificial fill intensified destruction in San Francisco’s Marina District. The earthquake became a regional catastrophe because geology, construction, utilities, and transportation systems turned one seismic event into sharply different local disasters.
The 1989 earthquake at a glance
Loma Prieta earthquake: essential facts
- Date: Tuesday, October 17, 1989
- Time: 5:04 p.m. Pacific Daylight Time
- Primary size measure: Moment magnitude 6.9
- Epicenter: Santa Cruz Mountains near Loma Prieta
- Location relative to cities: Approximately 10 miles northeast of Santa Cruz and roughly 56–60 miles south of San Francisco
- Depth: Approximately 11–12 miles
- Maximum reported intensity: Modified Mercalli IX, or Violent
- Principal official toll: 63 deaths and 3,757 injuries
- Reported shaking duration: Roughly 10–20 seconds, reflecting differences among published sources
- Economic loss: Approximately $5.6–6.8 billion in direct or property damage; broader estimates including business interruption reached as high as $10 billion
- Other names: San Francisco–Oakland earthquake, World Series earthquake, and Earthquake Series
NIST reports the 5:04 p.m. time, moment magnitude 6.9, a duration of 10–15 seconds, and the principal casualty totals. Published geological summaries place the focal depth near 11–12 miles and the maximum intensity at IX. The California Geological Survey reports the upper direct-damage and business-interruption estimates. NIST provides an official overview of the earthquake and its principal losses.
The earthquake’s geographically precise name is the Loma Prieta earthquake, after the mountainous area near its epicenter. It was not centered in San Francisco. The affected region extended across the Central Coast and the wider San Francisco Bay Area, including Santa Cruz, Watsonville, Oakland, Alameda, Santa Clara, Monterey, and San Francisco.
Published duration estimates differ. NIST reports 10–15 seconds, while the California Geological Survey gives 20 seconds. Because the sources do not establish a single reason for the discrepancy, a range is more responsible than claiming the shaking lasted one exact number of seconds.
The official figures most consistently supported by government sources are 63 deaths and 3,757 injuries. The loss of life was not distributed evenly: a small number of structural failures accounted for most fatalities.
Economic estimates also require careful labeling. Direct or property-loss estimates commonly fall between approximately $5.6 billion and $6.8 billion in nominal 1989 dollars. A broader figure of as much as $10 billion includes business interruption and should not be described as direct physical damage. These historical totals are not inflation-adjusted present-day amounts.
The event’s alternative names reveal how it was remembered. “San Francisco–Oakland earthquake” emphasizes the major Bay Area cities whose infrastructure failures dominated television coverage. “World Series earthquake” reflects its timing shortly before a nationally televised baseball game. “Loma Prieta,” however, best identifies where the earthquake originated and preserves the regional nature of the disaster.
A timeline of the mainshock, aftershocks, and World Series interruption
On the afternoon of October 17, attention throughout the Bay Area was focused on baseball. The San Francisco Giants and Oakland Athletics were preparing for Game 3 of the World Series at Candlestick Park. Because the two teams came from opposite sides of the bay, the series already had unusual local significance.
At 5:04 p.m. PDT, shortly before the scheduled game, the mainshock struck. National television crews were already broadcasting from the stadium, giving viewers outside California an immediate connection to the unfolding emergency.
The first moments cannot be reduced to one uniform experience. Shaking severity depended on location, ground conditions, and the structures people occupied. Across the region, buildings moved violently, electrical service and communications were interrupted, transportation structures failed, masonry fell, and fires began. Emergency response started amid blocked roads, broken utilities, uncertain building conditions, and incomplete information about the disaster’s extent.
Candlestick Park remained standing, but the game did not proceed. The World Series was suspended for 10 days, producing the enduring “World Series earthquake” and “Earthquake Series” labels. The timing and live broadcast made the disaster unusually visible, although much of the gravest damage occurred far from the stadium. Britannica summarizes the earthquake’s regional effects and the 10-day World Series interruption.
Seismic activity continued almost immediately. A magnitude 5.2 aftershock occurred approximately 2.5 minutes after the mainshock. During the following week, monitoring recorded 20 aftershocks of magnitude 4.0 or greater and more than 300 of magnitude 2.5 or greater; smaller events continued beyond that initial period. The California Geological Survey reports the mainshock location, aftershock sequence, losses, and economic estimates.
The evening’s history should not be embellished with the claim that World Series traffic definitively saved lives. The game may have altered travel patterns, but the casualty total under an ordinary commute cannot be measured. The defensible conclusion is narrower: the earthquake struck during the evening travel period, shortly before a major sporting event, and its deadliest failure involved a heavily used freeway.
Magnitude, intensity, depth, and the San Andreas Fault question
The primary modern measure of Loma Prieta’s size is moment magnitude 6.9. Different analyses or magnitude scales can produce somewhat different numerical estimates, but magnitude does not change from neighborhood to neighborhood in the way shaking intensity does.
Intensity answers a different question: how severe was the shaking, and what effects were observed at a particular place? Loma Prieta’s maximum reported Modified Mercalli intensity was IX, or Violent.
The Roman numeral IX is not another way of writing magnitude 9. Modified Mercalli intensity is commonly written with Roman numerals partly to distinguish it from magnitude. Intensity can vary widely across the region because seismic waves interact with local soils, terrain, buildings, and distance from the rupture. The USGS comparison of the 1989 and 1906 earthquakes explains Modified Mercalli intensity and shows their different shaking patterns.
Some historical accounts give values such as 7.0 or 7.1. These generally represent different magnitude scales rather than interchangeable versions of the same measurement. Moment magnitude, local or “Richter” magnitude, and surface-wave magnitude are calculated differently. For a clear modern summary, moment magnitude 6.9 is the appropriate headline value.
The earthquake began approximately 11–12 miles underground. This underground starting point is the hypocenter, also called the focus. The epicenter is the corresponding location on Earth’s surface directly above it. Saying the epicenter was in the Santa Cruz Mountains therefore does not mean the rupture began at the surface.
Focal depth also should not be confused with distance from Santa Cruz or San Francisco. Depth is the vertical distance to the underground origin. Epicentral distance is the surface distance between the epicenter and another location. Neither figure alone predicts what will happen to a particular building.
Did it rupture the San Andreas Fault itself?
The safest concise description is that Loma Prieta was associated with the San Andreas Fault system. Several official and institutional summaries describe it as slip on or along the San Andreas Fault, placing it within the plate-boundary system between the Pacific and North American plates.
The more technical question—whether the rupture occurred on the mapped main trace or a nearby strand—is less straightforward. Some accounts place the event directly on the San Andreas Fault. Other reporting describes a neighboring sub-parallel or oblique-slip strand near the main fault.
A Los Angeles Times report citing USGS research geologist Kate Scharer presents the adjacent-strand interpretation rather than placing the rupture directly on the main plate-boundary fault. The report describes the interpretation that Loma Prieta occurred on a neighboring sub-parallel strand.
These descriptions are not necessarily incompatible at the broadest level. A general history can therefore place Loma Prieta within the San Andreas Fault system while avoiding unsupported certainty about the exact rupture plane.
That distinction also corrects a common misconception about earthquakes as isolated points on a map. The epicenter marks one surface location, but damaging energy comes from rupture through rock underground. Seismic waves then travel outward and interact with ground conditions, structures, bridges, roads, and utilities.
A regional map of the damage
The clearest way to understand Loma Prieta is to move across the affected region instead of treating San Francisco as the sole disaster area. Each major loss reflected a different combination of shaking, soil, structural vulnerability, and infrastructure design.
NIST identifies the best-known fatal collapses: 42 deaths at Oakland’s Cypress Street Viaduct, one on the Bay Bridge, three at Santa Cruz’s Pacific Garden Mall, and five beside a collapsed brick wall on Bluxome Street in San Francisco. NIST documents these casualty locations and the associated structural failures.
Oakland: the Cypress Street Viaduct
The earthquake’s greatest concentration of fatalities occurred at the Cypress Street Viaduct in Oakland. The structure was part of Interstate 880, commonly called the Nimitz Freeway, and carried traffic on two levels.
During the earthquake, portions of the upper roadway fell onto the lower roadway, crushing and trapping vehicles between the decks. The 42 deaths there accounted for two-thirds of the official toll of 63.
The collapse became the defining example of Loma Prieta’s transportation failures. It showed how one vulnerable structure could dominate the human toll even at a substantial distance from the epicentral region.
San Francisco–Oakland Bay Bridge
On the Bay Bridge, an approximately 50-foot section of the upper deck fell onto the lower deck, causing one death. The failure severed a primary road connection between San Francisco and the East Bay, and the bridge was unusable for about one month.
Although the failed section was much smaller than the Cypress collapse, the bridge’s importance to the transportation network magnified the disruption. Its damaged deck also became one of the earthquake’s most recognizable televised images.
San Francisco: the Marina and Bluxome Street
San Francisco’s most concentrated neighborhood damage occurred in the Marina District. Parts of the neighborhood stood on loose sandy and artificial fill susceptible to ground failure. Buildings shifted or suffered first-story damage, utility lines broke, and fires compounded the initial destruction.
Elsewhere in the city, falling masonry proved deadly. Five people died when a brick wall collapsed on Bluxome Street. That loss illustrates a hazard distinct from the complete collapse of an occupied building: exterior masonry and other unsecured components can fall into streets, sidewalks, and neighboring properties.
Damage within San Francisco was highly uneven. Buildings on firmer ground did not necessarily experience the same outcomes as structures on susceptible fill. Construction, foundations, alterations, and site conditions could produce markedly different results from one neighborhood—or block—to another.
Santa Cruz: downtown masonry failures
Santa Cruz was much closer to the epicenter and suffered extensive downtown destruction. Older unreinforced masonry buildings were especially vulnerable. Walls and other structural elements without adequate reinforcement or secure connections to floors and roofs could separate under lateral shaking.
Three people died in the Pacific Garden Mall collapse. The broader destruction transformed downtown Santa Cruz and demonstrated that proximity was only part of the explanation. Strong shaking acted on a vulnerable building stock, turning structural weaknesses into wall failures, falling debris, commercial losses, and deaths.
Watsonville and the Central Coast
Watsonville experienced severe residential and commercial destruction. HISTORY reports estimates that more than 30 percent of downtown and one in eight houses were destroyed. These should be read as published historical estimates rather than a complete modern building inventory. HISTORY describes Watsonville’s losses, the Marina fires, and the major bridge and freeway collapses.
Watsonville is essential to the regional story because it corrects the impression that the disaster was concentrated only in the Bay Area’s most famous locations. Communities nearer the epicenter faced damaged homes, disrupted businesses, and difficult recovery conditions without receiving the sustained national attention given to the Bay Bridge, Cypress structure, or Marina District.
Damage also extended through Alameda, Santa Clara, Monterey, and other Central Coast and Bay Area communities. The pattern was irregular rather than a simple fading circle around the epicenter. Some more distant locations suffered concentrated destruction because soils or infrastructure amplified the consequences, while some nearer sites performed better where ground and construction conditions were more favorable.
Why damage was severe far from the epicenter
Earthquake damage does not depend only on distance.
That is why Oakland and San Francisco suffered devastating failures even though the epicenter was near Santa Cruz. The earthquake’s effects were filtered through the landscape and built environment.
Liquefaction in plain language
The soil does not literally become an ordinary liquid, but it can stop providing stable support for buildings, roads, and buried utilities.
Roads can deform, and pipes can break as adjacent sections of soil move unevenly.
The Marina District became the central example. Its loose sandy and artificial fill was especially susceptible to liquefaction and related ground movement. Buildings were undermined, while gas and water systems were damaged. Britannica identifies the Marina’s underlying loose fill as a major reason for the district’s concentrated losses.
Broken utilities created a cascading emergency. The progression from shaking to ground failure, broken services, and fire shows why earthquake loss cannot be understood as structural shaking damage alone.
Landslides near the epicentral region
In the Santa Cruz Mountains and other steep terrain, the earthquake triggered landslides and rockfalls. Shaking can destabilize slopes, move material across roads, and obstruct routes needed by residents and emergency services.
Published counts vary from hundreds of observed failures to estimates in the thousands. The sources do not establish a single directly comparable total, and differences may reflect survey areas or what was counted as a landslide or rockfall. The reliable conclusion is that slope failure was a major secondary hazard, particularly around the epicentral region.
Unreinforced masonry in Santa Cruz
Downtown Santa Cruz illustrates a different damage mechanism. Older unreinforced masonry buildings use brick or similar masonry without the reinforcing systems expected in newer construction. During strong sideways movement, walls can separate from roofs and floors or fail outward.
The city’s proximity to the earthquake contributed to severe shaking, but closeness alone does not explain why particular buildings collapsed. Vulnerable construction converted that shaking into falling walls, loss of life, and destruction of commercial space.
Soft-story vulnerability
Loma Prieta also demonstrated the danger of soft-story construction.
During an earthquake, deformation can concentrate in that weaker level. Upper floors may remain comparatively intact while the first story leans or collapses. Several wood-frame apartment and condominium buildings in the Marina experienced first-story failures associated with soft-story configurations.
The lesson concerns structural configuration, not simply age or material. A wood-frame building’s performance depends on its foundation, load path, connections, openings, alterations, and overall arrangement.
Why some structures performed better
Engineering accounts indicate that many newer or more strongly regulated structures performed better than the most visible failures, although this was not universal. The defensible lesson is not that newer buildings were immune, but that reinforcement, reliable connections, suitable foundations, and attention to site conditions can materially affect performance.
Earthquake resilience also extends beyond the primary structural frame. Ceilings, exterior panels, glass, shelves, and equipment can fall or shift, injuring occupants or leaving a standing building unusable. A building’s ability to avoid collapse and its ability to remain safe and functional are related but different measures of performance. An engineering case summary discusses soft-story failures, unreinforced masonry, nonstructural damage, and the comparatively stronger performance of several regulated building types.
Loma Prieta’s damage pattern can be summarized as a chain:
- A regional fault rupture generated strong shaking.
- Seismic waves reached communities at different distances.
- Local ground amplified motion or lost strength in susceptible areas.
- Vulnerable buildings and transportation structures failed.
- Broken utilities, fires, landslides, and blocked routes compounded the initial damage.
- Those combined failures shaped casualties, displacement, and recovery.
The human and economic toll—and why the totals vary
The best-supported principal toll is 63 deaths and 3,757 injuries. Some secondary accounts report approximately 62 or 67 deaths, but the reviewed evidence does not establish why those historical counts differ. Differences in disaster records can result from definitions or later revisions, but assigning a specific explanation here would be speculation.
The concentration of fatalities is better established:
- 42 at the Cypress Street Viaduct in Oakland
- 1 on the San Francisco–Oakland Bay Bridge
- 3 in the Pacific Garden Mall collapse in Santa Cruz
- 5 in the Bluxome Street wall collapse in San Francisco
Together, these locations account for 51 of the official 63 deaths. The pattern shows that the toll was heavily shaped by a few catastrophic structural failures rather than distributed evenly across the affected region.
Displaced is not necessarily the same as homeless
Population-impact figures differ because the categories are not identical. The California Geological Survey reports 12,053 displaced people, while NIST estimates that approximately 3,000–12,000 people were left homeless.
A displaced person might have been unable to remain at home temporarily because of evacuation, inspection, utility failure, or neighborhood conditions. “Homeless” may be defined more narrowly or differently by a particular source. Neither figure is necessarily identical to the number of people who entered a shelter.
The California Geological Survey also reports 18,306 houses damaged and 963 destroyed, along with 2,575 businesses damaged and 147 destroyed. Its account estimates direct damage at $6.8 billion and total damage plus business interruption at as much as $10 billion. These institutional figures should not be merged casually with totals based on different boundaries or damage classifications. The California Geological Survey provides the displacement, housing, business, and economic-loss figures.
Direct damage versus broader economic loss
Common direct or property-loss estimates range from approximately $5.6 billion to $6.8 billion. Broader estimates reached as high as $10 billion when business interruption was included. These are nominal estimates in 1989 dollars, not present-day equivalents.
The distinction matters. Saying the earthquake caused exactly $10 billion in property damage would combine unlike categories and overstate the precision of the historical record.
| Measure | Reported figures | How to interpret the difference |
|---|---|---|
| Deaths | 63 in NIST and California Geological Survey accounts; approximately 62 or 67 in some secondary histories | Use 63 as the principal toll; the evidence does not establish why other counts differ |
| Shaking duration | Roughly 10–15 seconds in NIST and several summaries; 20 seconds from the California Geological Survey | Use a range rather than asserting one exact duration |
| Displacement or homelessness | 12,053 displaced; approximately 3,000–12,000 homeless | The categories may overlap but are not necessarily identical |
| Economic loss | Approximately $5.6–6.8 billion in direct or property damage; as much as $10 billion including business interruption | Do not present the broader estimate as direct physical damage |
These disagreements do not make the basic history unknowable. They show why disaster totals need clear labels, attribution, and attention to what each source counted.
Emergency response and the first stages of recovery
The initial response involved several distinct challenges. Injured people needed treatment. Residents needed shelter and meals. Families sought information about missing relatives. Inspectors had to decide whether damaged buildings were safe. Fires and broken utilities required control, while failed transportation links complicated movement throughout the region.
Shelter demand could increase after the first night. A building occupied immediately after the earthquake might later be declared unsafe following inspection. Residents who initially stayed outdoors or with relatives could subsequently need formal assistance.
The American Red Cross says that more than 7,800 Red Cross workers, including nearly 7,300 volunteers, participated in its response. The organization reports opening 45 shelters that housed nearly 65,000 people, serving nearly 643,000 meals, providing disaster health services to more than 8,600 people, and assisting nearly 15,000 families with immediate needs. Its retrospective does not clarify whether the shelter total represents unique individuals or cumulative shelter use, so it should not be treated as proof that 65,000 separate residents were homeless. The American Red Cross provides its institutional account of the relief operation.
The organization also reports receiving and fulfilling nearly 6,500 inquiries concerning immediate family members. That figure points to a communications challenge easily obscured by images of physical destruction: when telephone service and travel are interrupted, confirming the safety of relatives becomes a major part of disaster response.
According to the same retrospective, the Red Cross spent $24.5 million on immediate needs and designated another $40.3 million for long-term recovery. These were organizational relief and recovery expenditures. They are not additional estimates of total earthquake damage and should not be added to property-loss figures as though the amounts measured the same thing.
Building inspection was another essential task. Damage was not always apparent from outside, and aftershocks prolonged uncertainty. Inspection decisions affected whether residents could return, businesses could reopen, and additional temporary housing would be required.
Transportation recovery was especially difficult because the earthquake damaged critical regional links. The Bay Bridge remained unusable for about one month. The Cypress collapse removed an important East Bay freeway segment while creating a complex rescue, recovery, and investigation site.
Engineering investigation began almost immediately. Following congressional requests made on October 18, 1989, NIST investigators examined Interstate 880 and other bridge damage from October 18 through October 26. Their fieldwork helped turn damaged structures into evidence about failure mechanisms and future engineering needs.
Recovery did not proceed at one speed. Bridge repair, downtown reconstruction, housing replacement, business recovery, and survivors’ emotional recovery followed different timelines. The World Series resumed after 10 days and the Bay Bridge returned to service after about a month, but those visible milestones did not mean affected households and communities had fully recovered.
How Loma Prieta changed earthquake planning
Loma Prieta exposed weaknesses across multiple layers of the built environment:
- Elevated freeways and bridges
- Older unreinforced masonry buildings
- Soft-story apartments and condominiums
- Gas, water, power, and communications systems
- Structures on loose or liquefaction-prone soils
- Development near unstable slopes
- Nonstructural components inside otherwise standing buildings
The central lesson was not that one material or one city had failed. Regional resilience depends on interconnected systems. A bridge may remain repairable yet still isolate commuters. A standing building may become uninhabitable because its utilities fail. Firefighting may be constrained by damaged water lines. A usable facility may be difficult to reach when roads are blocked.
Bridges and transportation retrofits
Bay Area bridges subsequently underwent seismic retrofitting. Britannica identifies bridge retrofitting as part of the earthquake’s long-term legacy.
Retrofit should not be confused with the elimination of risk. It is intended to reduce identified vulnerabilities, not make a bridge or roadway immune to every earthquake or form of ground movement.
Masonry and soft-story buildings
Communities also adopted stricter requirements addressing unreinforced masonry. HISTORY records the adoption of stricter retrofit regulations after the disaster.
Soft-story risks received greater attention as well. Strengthening can add frames, walls, or other lateral-resistance elements at the weak level, although the appropriate approach depends on the individual building. The broader legacy was increased recognition that an ordinary-looking garage, storefront, or open parking level could create a concentrated weakness.
Mapping the ground beneath buildings
One year after the earthquake, California enacted legislation directing the California Geological Survey to identify and map areas susceptible to liquefaction, earthquake-induced landslides, and amplified ground shaking. The resulting approach recognized that earthquake planning must consider much more than fault lines.
A landslide-hazard map considers slope failure. These are related but distinct layers of seismic risk.
That distinction matters for land use, engineering, emergency planning, and public understanding. A property can be some distance from a major fault yet remain vulnerable to strong shaking or liquefaction. Conversely, proximity to an epicenter does not automatically produce the worst structural outcome if the site and building perform well.
Was Loma Prieta the Bay Area’s “big one”?
“The big one” has no precise threshold in this context. It is a popular expression rather than a formal earthquake category. Loma Prieta was devastating and is widely characterized as the region’s most damaging earthquake since 1906, but the two events were not equivalent in rupture or regional shaking scale.
USGS comparisons show different intensity patterns for the 1989 and 1906 earthquakes. Loma Prieta should therefore not be treated as a repeat of 1906 merely because both affected San Francisco and were associated with the broader San Andreas system.
Nor did Loma Prieta settle the question of future regional risk. Subsequent retrofits and hazard programs reduced particular vulnerabilities but did not eliminate earthquake hazards. USGS describes the event as a catalyst for improved understanding of Bay Area seismic threats and greater public awareness. The USGS retrospective presents Loma Prieta as a continuing catalyst for seismic-hazard awareness.
Historical earthquakes also do not provide a calendar for the next one. Earlier earthquakes near Loma Prieta did not amount to a successful prediction of the mainshock’s exact time, place, and magnitude. The date of the 1989 event likewise cannot be used to calculate when another damaging earthquake will occur.
The responsible distinction is between hazard and forecasting. The Bay Area faces long-term seismic hazards arising from active faults, susceptible ground, slopes, buildings, and infrastructure. That does not permit a damaging earthquake to be predicted for a particular date.
Frequently asked questions
Was the 1989 earthquake centered in San Francisco?
No. Its epicenter was in the Santa Cruz Mountains near Loma Prieta, approximately 10 miles northeast of Santa Cruz and roughly 56–60 miles south of San Francisco.
San Francisco suffered serious damage, especially in the Marina District, but it was one part of a broader Central Coast and Bay Area disaster.
Why is it called the Loma Prieta or World Series earthquake?
“Loma Prieta earthquake” refers to the area near the epicenter and is the most geographically precise name.
“World Series earthquake” reflects its timing shortly before Game 3 between the San Francisco Giants and Oakland Athletics. The nationally televised series was suspended for 10 days.
How many people died in the 1989 Loma Prieta earthquake?
The principal official toll is 63 deaths and 3,757 injuries. Of those deaths, 42 occurred in the Cypress Street Viaduct collapse—the largest concentration of fatalities.
Some secondary histories give totals of approximately 62 or 67, but the available evidence does not establish the reason for those differences.
Did the Loma Prieta earthquake occur on the San Andreas Fault?
It is safest to say that the earthquake was associated with the San Andreas Fault system. Several institutional summaries describe slip along the San Andreas Fault, while another interpretation places the rupture on a nearby sub-parallel or oblique-slip strand.
The broader tectonic association is clear, but the reviewed sources do not justify absolute certainty about the precise rupture plane.
Was the 1989 earthquake as large as the 1906 San Francisco earthquake?
No. Loma Prieta was a destructive moment magnitude 6.9 earthquake, but “the most damaging since 1906” does not mean “equal to 1906.”
The events differed in rupture extent and regional shaking. Loma Prieta’s consequences were more regionally concentrated and were strongly shaped by vulnerable structures and local ground conditions.
The event remembered as the 1989 San Francisco earthquake began near Loma Prieta and became a regional disaster because susceptible soils, vulnerable structures, utility failures, and transportation collapses concentrated losses across Santa Cruz, Watsonville, Oakland, San Francisco, and surrounding communities. Its clearest legacy is not a prediction of the next earthquake, but evidence that construction choices, ground conditions, infrastructure design, and sustained preparation help determine how destructive future shaking becomes.